Dashboards -- Creating, Editing, and Deleting Dashboards
The Dashboards tool allows you and your sponsors/advertisers to review and download lead data collected from your protected and/or sponsored digital assets--or web resources(such as sponsored whitepapers, video, premium content), newsletter campaigns, and banner ad campaigns.
OPENING THE DASHBOARD WINDOW
Select ANALYTICS & DASHBOARD from the main menu.
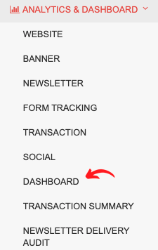
Select Dashboard from the sub-menu.
This will open the Dashboard listing page where all Dashboards are listed in alphabetical order, as shown below. Note the search, page-through, and "Create Dashboard" functionality.
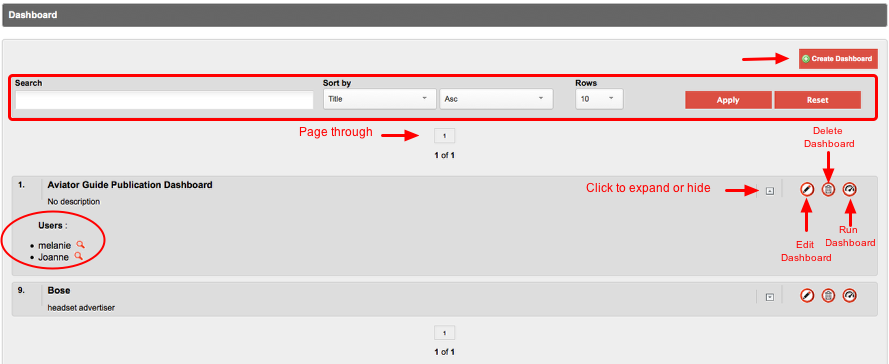
If you click to expand detail on a dashboard, you'll see dashboard users with permission to access that particular dashboard.
Note re: Dashboard Users
- There are two types of user accounts in ONEcount: Admin and Dashboard.
- Admin users can access any or all of the modules in ONEcount, and Dashboard user have access only to an assigned Dashboard.
- A sponsor/advertiser must have a Dashboard-type user account to access their assigne Dashboard.
- A Dashboard-type user account allows a sponsor/advertiser permission to access their Dashboard only. They cannot access other dashboards or the ONEcount system.
- Admin-type users can access Dashboards if such permission is granted them.
- To download demographic detail on known visitors, Admin-type users also need permissions for "Lists and Reports" and "Download".
Backend user accounts are created under Backend Users in the Utilities module.
CREATE DASHBOARD
Click "Create Dashboard".
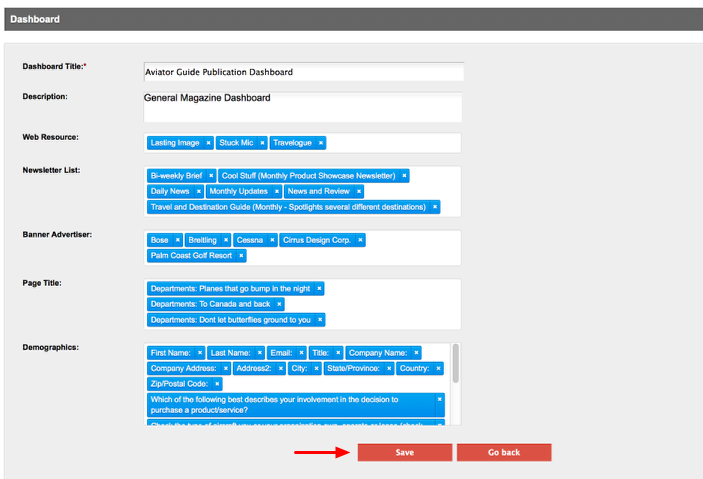
Add information and make selections.

1 – Enter the Dashboard Title. (required)
2 – Enter a description of the dashboard.
3. Select Segments to include in the Dashboard***. When you click in the blank field, a drop-down list of segments will come up. Alternatively, you can begin typing in the blank field to find a segment(s).
4. Select the Banner Advertiser(s) to include in the Dashboard***. When you click in the blank field, a drop-down list of banner advertisers will come up. Alternatively, you can begin typing in the blank field to find an advertiser(s).
5 – Select any Newsletter Vendor to include in the Dashboard***. When you click in the blank field, a drop-down list of newsletter Vendors will come up. Alternatively, you can begin typing in the blank field to find a newsletter vendor(s).
- After selection of vendor you can select any Newsletter Lists to include in the Dashboard*** from that vendor. When you click in the blank field, a drop-down list of newsletter Lists will come up. Alternatively, you can begin typing in the blank field to find a newsletter Lists(s).
- You can also type full or partial click urls which should be excluded from newsletter analytics.
6 – Select the Content(Keywords) to include in the Dashboard***. When you click in the blank field, a drop-down list of Keywords will come up. Alternatively, you can begin typing in the blank field to find a keyword(s).
7 - Select the Insertion Order to include in the Dashboard***. When you click in the blank field, a drop-down list of Orders will come up. Alternatively, you can begin typing in the blank field to find an Order(s).
8 - Select the Transactional products to include in the Dashboard***. When you click in the blank field, a drop-down list of Transactional products will come up. Alternatively, you can begin typing in the blank field to find a Products. These selections are used in transaction analytics.
9 - Select the Transactional terms to include in the Dashboard***. When you click in the blank field, a drop-down list of Transactional terms will come up. Alternatively, you can begin typing in the blank field to find a terms. These selections are used in transaction analytics.
10 - Select the demographics to be available for selection in a downloadable user report. This allows you to restrict accessibility of user information. Only the demographics included here will be available for viewing/download.
11 – Select Web Products to include in the Dashboard***. When you click in the blank field, a drop-down list of products will come up. Alternatively, you can begin typing in the blank field to find a product(s).
12 – Select File Products to include in the Dashboard***. When you click in the blank field, a drop-down list of products will come up. Alternatively, you can begin typing in the blank field to find a product(s).
- For an advertiser dashboard, select Web Products, Advertisers and Newsletter Lists that the advertiser sponsors. For example, if the advertiser sponsors a section of your web site, videos, and/or whitepapers, select them from the drop-down menu. Only those items selected will be available to pull stats on in the Dashboard. For "Banner Advertiser:", select the advertiser(s) from the drop-down list. Only banner campaigns for the selected advertiser will be available in the Dashboard.
See below for a screenshot of a Dashboard with selections made.
Save the Dashboard.
Click "Save" when you've made all selections.
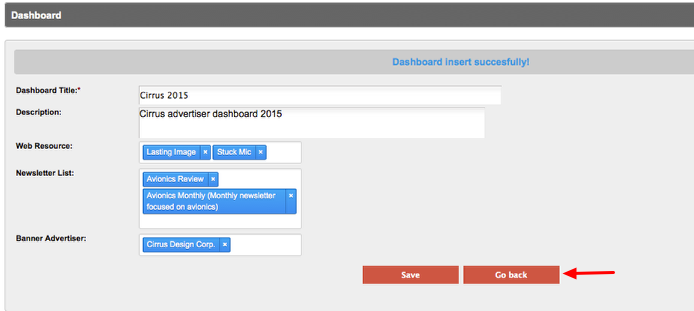
A message, as shown below, will display indicating the Dashboard was saved.
Click "Go back" button to return to Dashboard main listing page.
EDIT DASHBOARD

On the main listing page, click on the edit icon to make any changes to a dashboard, i.e. change the Title, Description, Web Resources, Newsletter Lists, and/or Banner Advertisers associated with the dashboard.
DELETE DASHBOARD

On the main listing page, click on the delete icon to delete a dashboard from the system.
HIDE CHARTS IN DASHBOARD SCREENS
- Go to Dashboard and create a dashboard or edit an existing dashboard.
- Click on Hide Charts field and select the chart you want to hide from the options.

- You can select multiple charts at once in hide chart fields.
- Click on Save button to save the dashboard.
- Once dashboard is saved all the charts from hide charts field will be hidden in dashboard analytics.
Search all Documentation:
Unknown macro: livesearch. Click on this message for details.
Search Dashboards Documentation:
Unknown macro: pagetreesearch. Click on this message for details.
Click here to expand...