Analytics - Running Web Analytics
The Website Analytics tool allows you to save, view, or download detailed known and unknown view statistics, including top URLs, referrers, and device analytics for various pages/sections of your website within a specified date range.
The following lesson provides instruction on how to run website analytics.
OPEN THE WEB ANALYTICS WINDOW
Select ANALYTICS & DASHBOARD from the main menu.
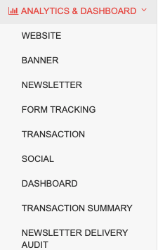
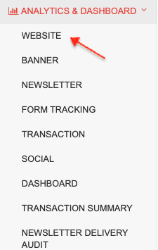
Select WEBSITE from the sub-menu.
This will bring you to the Web Analytics main window, as shown below.
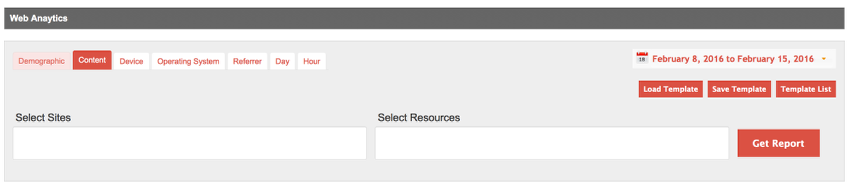
Note that there are 7 tabs in Web Analytics:
- Demographic – pulls analytics data for a selected demographic
- Content - pulls analytics data by site content only
- Device – pulls analytics data by device used to access site
- Operating System – pulls analytics data by operating system used
- Referrer – pulls analytics data by site referrers*
- Day - pulls analytics data by days of the week
- Hour – pulls analytics data by hours of a day
All tabs include the options for selecting criteria shown in the screenshot below.
*To create a filter in Google Analytics to remove ONEcount as referrer traffic, please see this Google documentation: https://support.google.com/analytics/answer/10348...
DEFINITIONS OF METRICS AND TERMS
Known -* A user who is in the ONEcount system and has been authenticated and identified.
Unknown = Includes counts of those users who are not authenticated/have not been identified by the ONEcount system. A user may be in your database but be an unkown if they haven't been authenticated by logging in, clicking on a smartlink in an email, or completing a subscription/registration form for a new product.
Total - Total of both Known and Unknown users.
Views - The total number of times the page/resource was viewed. This number includes multiple views by the same user.
Unique Views - The number of times the page was viewed, not including multiple views by the same user. The first view is the only view that is counted.
- A user must be authenticated and identified by ONEcount to be counted as a Known user. There are different ways to be identified: 1) By logging into a web site (direct log-in or via a lookup form), 2) by clicking on a smartlink** in an email blast, 3) by completing a registration/subscription form for a product. Once authenticated and identified, a cookie will be set, allowing you to track a user's activities as a Known user. If a user is not logged in/identified, activities will be tracked as an Unknown user. Once the user is authenticated and identified, all of his/her activities (including past activities) will be moved from Unknown statistics to Known statistics.*
Sessions - A session starts when a visitor first interacts with the web site. In most case the interaction is the first page view by the visitor. Every time a user interacts with an element of the site (like an event, social interaction, or opens a new page) the expiration time is reset by adding on an additional 30 minutes from the time of that interaction. A session ends when the user does not interact with the site for 30 minutes. So, if a visitor visits the site then goes away and comes back 35 minutes later, the activity is counted as two sessons.
Visitors - The total number of unique visitors who visited the website(s). (See Page Visit definition above.) Unique refers to the user only being counted once, even if they visited the site multiple times.
Average Time/View - Total time spent on a page divided by the total of views of a page. This metric is presented in seconds.
- A user must be authenticated and identified by ONEcount to be counted as a Known user. There are different ways to be identified: 1) By logging into a web site (direct log-in or via a lookup form), 2) by clicking on a smartlink** in an email blast, 3) by completing a registration/subscription form for a product. Once authenticated and identified, a cookie will be set, allowing you to track a user's activities as a Known user. If a user is not logged in/identified, activities will be tracked as an Unknown user. Once the user is authenticated and identified, all of his/her activities (including past activities) will be moved from Unknown statistics to Known statistics.*
Average Time/Session - Total duration of all sessions (in seconds) / number of sessions.
Entrance - The number of visits starting on a particular page or content area of a website.
Bounce Rate - The percentage of visitors who exit the site from the landing page itself, i.e. they exit the site from the page they came in on without navigating to any other pages. Bounce Rate can be sitewide or for an individual page. The rate is the total number of bounces divided by the total number of sessions.
Exit Rate - The percentage of visitors exiting the site from a particular page after having navigated there from other pages. The rate is the total number of Exits divided by the total number of Views. Exit rate is calculated for every page separately because it is the property of an individual page independent of any other page in the site.
WEB ANALYTICS TABS
CONTENT TAB
The "Content" tab is the default tab for Web Analytics. To run a report on the "Content" tab:
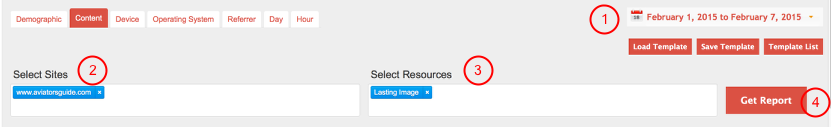
1) Set the date range.
2) Select site(s). *
3) Select resource(s)/page(s) (if any). If you want a report for the entire site, don't select resource(s)/page(s).**
4) Click "Get Report".
- Note that you can load a template or do a new selection of site(s) and resource(s).
**You can also enter the URL of a web page not designated as a resource.
(For section-type resources, all pages within that section will be included in the analytics. You don't need to enter the URL for individual pages within a designated section-type resource – just select the section then use the refine function to filter for a particular web page(s).
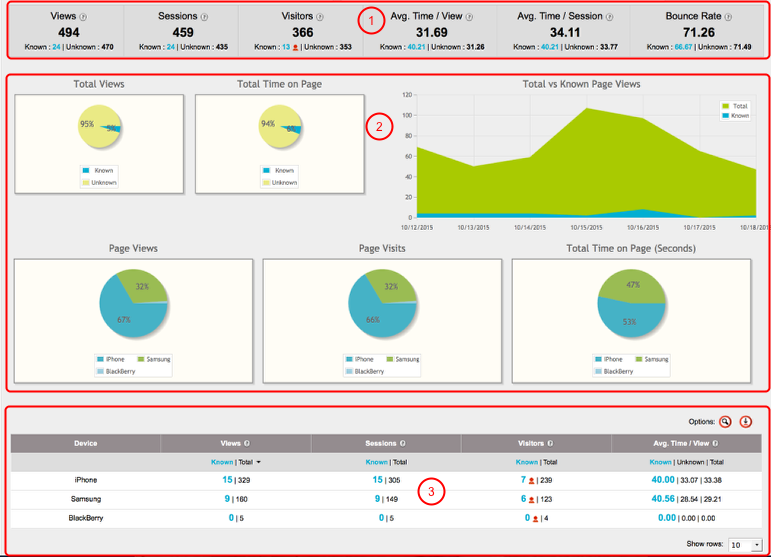
After clicking "Get Report", the report will load, as shown below.
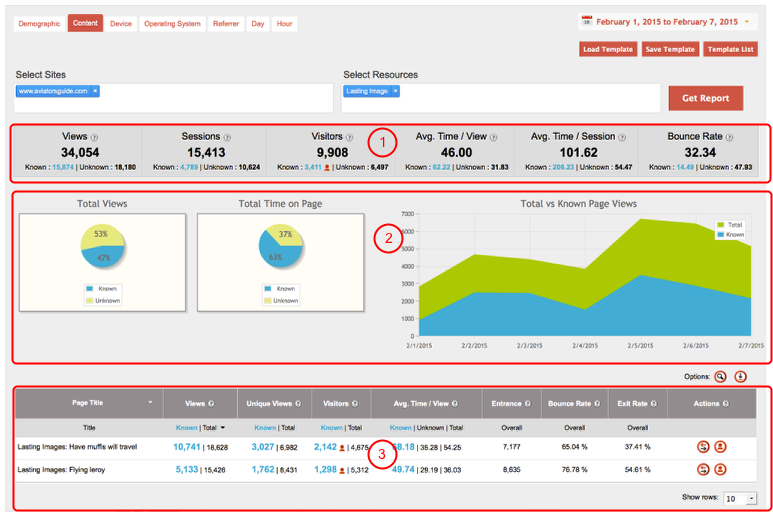
The report will display in three main sections:
1) Aggregate data for all sites and resources/pages selected.
2) Charts/graphical representation of key data
3) Breakdown and detail of aggregate data
All reports, for all tabs, break out applicable metrics by Known, Total, and Unknown. Please see above for definitions of metrics and terms.
DEMOGRAPHIC TAB
Use the Demographic tab to run reports for a selected demographic. You can select any multiple response-type question as your demographic.
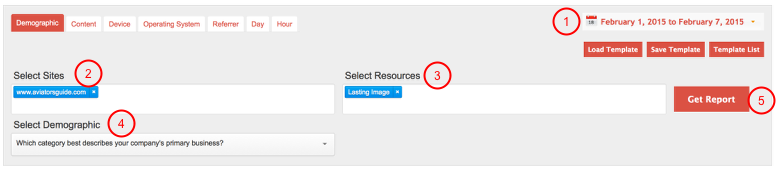
1) Set the date range.
2) Select site(s). *
3) Select resource(s)/page(s) (if any). If you want a report for the entire site, don't select resource(s)/page(s).**
4) Select the demographic question.
5) Click "Get Report".
- Note that you can load a template or do a new selection of site(s) and resource(s).
**You can also enter the URL of a web page not designated as a resource. (See example in screenshot below.)
(For section-type resources, all pages within that section will be included in the anaytics. You don't need to enter the URL for individual pages within a designated section-type resource – just select the section then use the refine function to filter for a particular web page(s).
After clicking "Get Report", the report will load, as shown below.
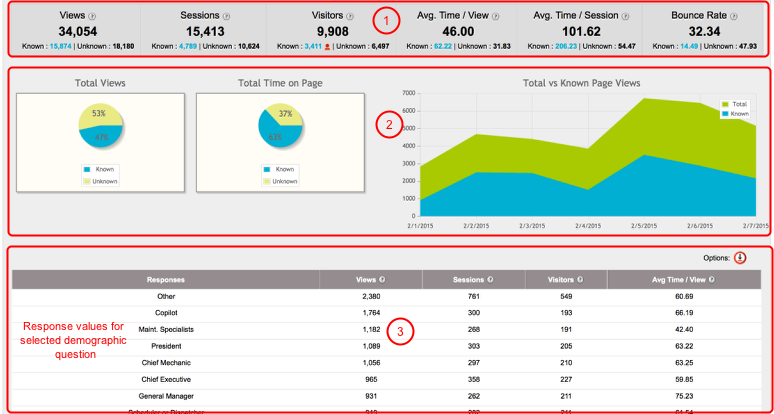
The report will disiplay in three main sections:
1) Aggregate data for all sites and resources/pages selected.
2) Charts/graphical representation of key data
3) Breakdown and detail of aggregate data
All reports, for all tabs, break out applicable metrics by Known, Total, and Unknown. Please see above for definitions of metrics and terms.
DEVICE TAB
Use the Device tab to run reports for selected devices.
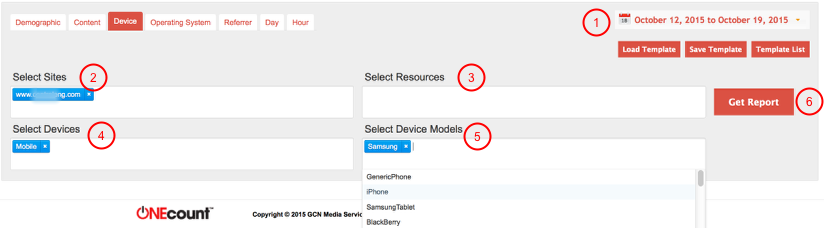
1) Set the date range.
2) Select site(s). *
3) Select resource(s)/page(s)** (if any). If you want a report for the entire site, don't select resource(s)/page(s).**
4) Select device(s). (Click in empty field to bring up a list of devices.)
5) Select device model(s). (Click in empty field to bring up a list of devices.)
6) Click "Get Report".
- Note that you can load a template or do a new selection of site(s) and resource(s).
**You can also enter the URL of a web page not designated as a resource. (See example in screenshot below.)
(For section-type resources, all pages within that section will be included in the anaytics. You don't need to enter the URL for individual pages within a designated section-type resource – just select the section then use the refine function to filter for a particular web page(s).
After clicking "Get Report", the report will load, as shown below.
The report will disiplay in three main sections:
1) Aggregate data for all sites and resources/pages selected.
2) Charts/graphical representation of key data
3) Breakdown and detail of aggregate data
All reports, for all tabs, break out applicable metrics by Known, Total, and Unknown. Please see above for definitions of metrics and terms.
OPERATING SYSTEM TAB
Use the Operating System tab to pull analytics data by operating system used.
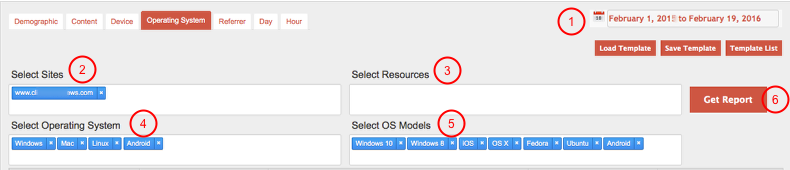
1) Set the date range.
2) Select site(s). *
3) Select resource(s)/page(s)** (if any). If you want a report for the entire site, don't select resource(s)/page(s).**
4) Select Operating System(s). (Click in empty field to bring up a list of operating systems.)
5) Select OS (Operating System) model(s). (Click in empty field to bring up a list of OS models.) OS Models are subsets of the Operating System, i.e. Mac OS has iOS and OSX OS Models, Windows OS has Windows 8 and Windows 10 OS Models, etc. Selecting specific models allows you to be more granular in results.
6) Click "Get Report".
- Note that you can load a template or do a new selection of site(s) and resource(s).
**You can also enter the URL of a web page not designated as a resource. (See example in screenshot below.)
(For section-type resources, all pages within that section will be included in the anaytics. You don't need to enter the URL for individual pages within a designated section-type resource – just select the section then use the refine function to filter for a particular web page(s).
After clicking "Get Report", the report will load, as shown below.
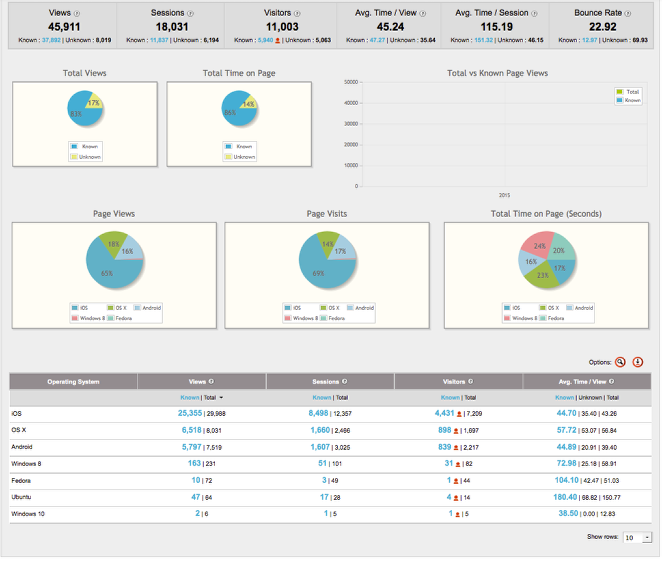
The report will display in three main sections:
1) Aggregate data for all sites and resources/pages selected
2) Charts/graphical representation of key data
3) Breakdown and detail of aggregate data
All reports, for all tabs, break out applicable metrics by Known, Total, and Unknown. Please see above for definitions of metrics and terms.
Please see Quick Start Guide - Website Analytics (v. 12.5) for information on the various report icons and options.
REFERRER TAB
Use the Referrer tab to pull analytics by refferer. An “http referrer” or “referrer” is anything online that drives visits and visitors to your website. This can include, but isn't limited to search engines, affiliate links, weblogs/list links.
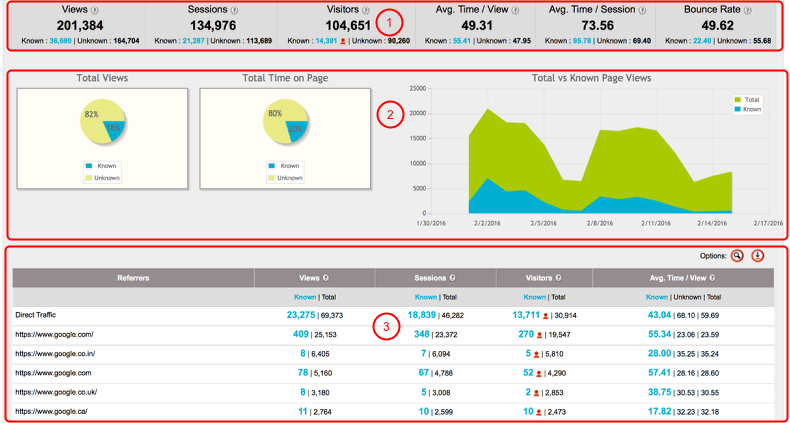
The report will disiplay in three main sections:
1) Aggregate data for all sites and resources/pages selected
2) Charts/graphical representation of key data
3) Breakdown and detail of aggregate data
All reports, for all tabs, break out applicable metrics by Known, Total, and Unknown. Please see above for definitions of metrics and terms.
Please see Quick Start Guide - Website Analytics (v. 12.5) for information on the various report icons and options.
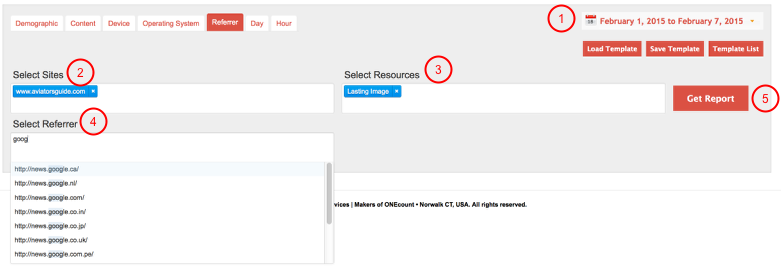
1) Set the date range.
2) Select site(s). *
3) Select resource(s)/page(s)** (if any). If you want a report for the entire site, don't select resource(s)/page(s).**
4) Select Referrer(s). To bring up a list of referrers, begin typing in the "Select Referrer" field, as shown above.
5) Click "Get Report".
- Note that you can load a template or do a new selection of site(s) and resource(s).
**You can also enter the URL of a web page not designated as a resource. (See example in screenshot below.)
(For section-type resources, all pages within that section will be included in the anaytics. You don't need to enter the URL for individual pages within a designated section-type resource – just select the section then use the refine function to filter for a particular web page(s).
After clicking "Get Report", the report will load, as shown below. The report below was generated without selecting a specific referrer.
DAY TAB
Use the Day tab to pull analytics by day of the week.
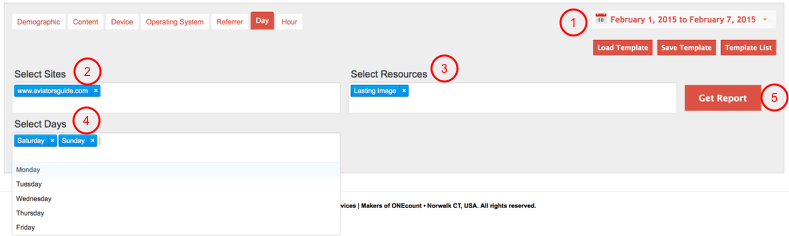
1) Set the date range.
2) Select site(s). *
3) Select resource(s)/page(s)** (if any). If you want a report for the entire site, don't select resource(s)/page(s).**
4) Select Day(s). (Click in empty field to bring up a list of days.)
5) Click "Get Report".
- Note that you can load a template or do a new selection of site(s) and resource(s).
**You can also enter the URL of a web page not designated as a resource. (See example in screenshot below.)
(For section-type resources, all pages within that section will be included in the anaytics. You don't need to enter the URL for individual pages within a designated section-type resource – just select the section then use the refine function to filter for a particular web page(s).
After clicking "Get Report", the report will load, as shown below.
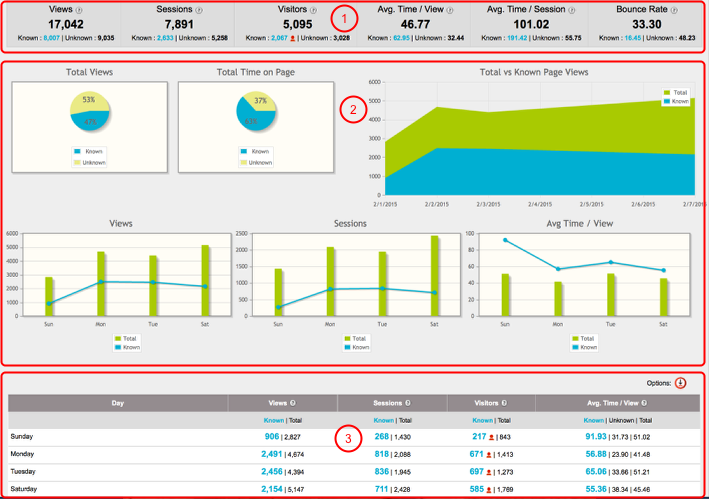
The report will disiplay in three main sections:
1) Aggregate data for all sites and resources/pages selected
2) Charts/graphical representation of key data
3) Breakdown and detail of aggregate data
All reports, for all tabs, break out applicable metrics by Known, Total, and Unknown. Please see above for definitions of metrics and terms.
Please see Quick Start Guide - Website Analytics (v. 12.5) for information on the various report icons and options.
HOUR TAB
Use the Day tab to pull analytics by hour of the day.
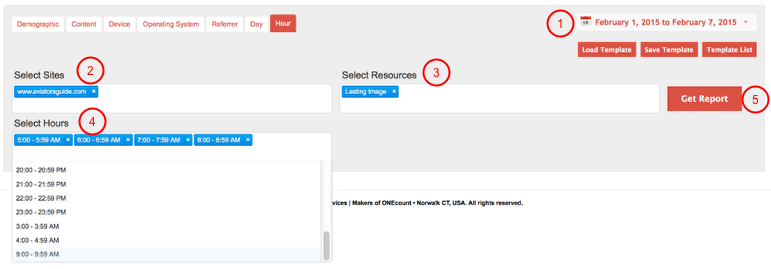
1) Set the date range.
2) Select site(s). *
3) Select resource(s)/page(s)** (if any). If you want a report for the entire site, don't select resource(s)/page(s).**
4) Select Hour(s). (Click in empty field to bring up a list of hours.)
5) Click "Get Report".
- Note that you can load a template or do a new selection of site(s) and resource(s).
**You can also enter the URL of a web page not designated as a resource. (See example in screenshot below.)
(For section-type resources, all pages within that section will be included in the anaytics. You don't need to enter the URL for individual pages within a designated section-type resource – just select the section then use the refine function to filter for a particular web page(s).
After clicking "Get Report", the report will load, as shown below.
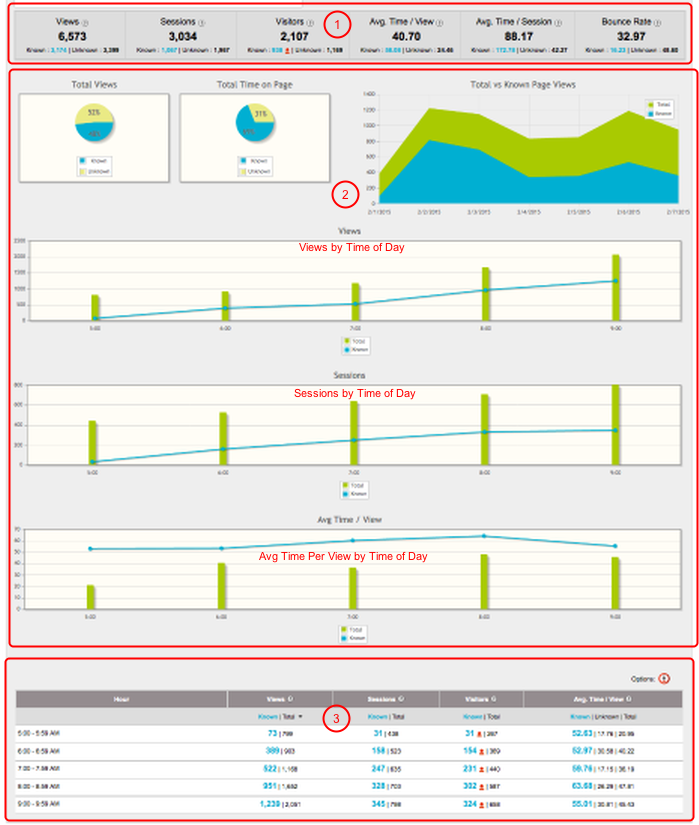
The report will disiplay in three main sections:
1) Aggregate data for all sites and resources/pages selected
2) Charts/graphical representation of key data
3) Breakdown and detail of aggregate data
All reports, for all tabs, break out applicable metrics by Known, Total, and Unknown. Please see above for definitions of metrics and terms.
Please see Quick Start Guide - Website Analytics (v. 12.5) for information on the various report icons and options.
Search all Documentation:
Unknown macro: livesearch. Click on this message for details.
Search ANALYTICS Documentation:
Unknown macro: pagetreesearch. Click on this message for details.
On this page:
More ANALYTICS Documentation: