Key Concepts - Web Analytics
The Analytics module consists of Website Analytics, Newsletter Analytics, and Banner/Ad Analytics and provides key analytics and insight into subscriber behavior across your online properties.
The Website Analytics tool allows you to save, view, or download detailed known and unknown view statistics, including top URLs, referrers, and device analytics for various pages/sections of your website within a specified date range.
The following lesson provides general information on using the Website Analytics tool.
DEFINITIONS
Resource - A resource is an identified and/or protected digital asset. A resource can be a web page or section of your website (such as a video library), e-newsletter, or file (a whitepaper, e.g.). Once a resource is attached to a product, that resource will be protected; and to access the resource, users will need to subscribe to/register for/purchase the product. (More detail on products and resources can be found in the Inventory module documentation.) A resource can be created without being attached to a product, thus not requiring user subscription/registration/purchase to access the resource but allowing analytics for that resource only to be easily pulled. (Products - How to Create a Product)
Known * - A user in your database who has been identified and authenticated by ONEcount.
Unknown -* A user who has not been authenticated/identified by the ONEcount system. A user may be in your database but be an unkown if they haven't been authenticated by logging in, clicking on a smartlink in an email, or completing a subscription/registration form for a new product.
Total - Total number of Known and Unknown users.
Views - The total number of times the page/resource was viewed. This number includes multiple views by the same user.
Unique Views - The number of times the page was viewed, not including multiple views by the same user. The first view is the only view that is counted.
- A user must be authenticated and identified by ONEcount to be counted as a Known user. There are different ways to be identified:
1) By logging into a web site (direct log-in or via a lookup form), 2) by clicking on a smartlink** in an email blast, 3) by completing a registration/subscription form for a product. Once authenticated and identified, a cookie will be set, allowing you to track a user's activities as a Known user. If a user is not logged in/identified, activities will be tracked as an Unknown user. Once the user is authenticated and identified, all of his/her activities (including past activities) will be moved from Unknown statistics to Known statistics.*
Sessions - A session starts when a visitor first interacts with the web site. In most case the interaction is the first page view by the visitor. Every time a user interacts with an element of the site (like an event, social interaction, or opens a new page) the expiration time is reset by adding on an additional 30 minutes from the time of that interaction. A session ends when the user does not interact with the site for 30 minutes. So, if a visitor visits the site then goes away and comes back 35 minutes later, the activity is counted as two sessons.
Visitors - The total number of unique visitors who visited the website(s). (See Page Visit definition above.) Unique refers to the user only being counted once, even if they visited the site multiple times.
Average Time/View - Total time spent on a page divided by the total of views of a page. This metric is presented in seconds.
Average Time/Session - Total duration of all sessions (in seconds) / number of sessions.
Entrance - The number of visits starting on a particular page or content area of a website.
Bounce Rate - The percentage of visitors who exit the site from the landing page itself, i.e. they exit the site from the page they came in on without navigating to any other pages. Bounce Rate can be sitewide or for an individual page. The rate is the total number of bounces divided by the total number of sessions.
Exit Rate - The percentage of visitors exiting the site from a particular page after having navigated there from other pages. The rate is the total number of Exits divided by the total number of Views. Exit rate is calculated for every page separately because it is the prperty of an individual page independent of any other page in the site.
IMPORTANT NOTE:
In order to identify users and track activity, widgets must be embedded on every page of your web site (placing them in the top-level template will accomplish this). These widgets, specific to your site(s), and directions for placement are provided in the Widget Builder. Please see Widget Builder documentation for moreinformation.
ONEcount Library/Tracker: This javascript snippet controls gating/access, cookie setting and does web tracking.
_Automation Widget: Automation scripts are snippets of javascript code that allow ONEcount to target actions (like ad target, popup target etc). This piece of javascript determines and outputs any automated action to the browser. _
_Noscript Tag: A noscript tag is needed to track requests when js is disabled. _
_Banner Trackers: Banner widgets are used to track and report banner activity. There are two banner platforms supported within ONEcount: OpenX and DFP (Premium and Small Business). _
_ Third Party Trackers Modifications: Usually websites will have third party trackers like Google Analytics, etc. installed on their website. A small piece of code needs to be added to those third party trackers so that ONEcount can pass the original referrer to those systems. We provide the code that needs to be added to your Google analytics code. If any other third party trackers are being used on your website, please let your ONEcount account manager know ahead of time. _
_ONEcount Pixel for Moat: ONEcount can collect ad viewability data from Moat's realtime pixel. In order to send data to ONEcount, Moat can fire a pixel like below to send data to ONEcount. _
OPEN THE WEB ANALYTICS WINDOW
Select ANALYTICS & DASHBOARD from the main menu.
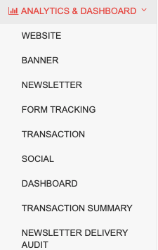
Select WEBSITE from the sub-menu.
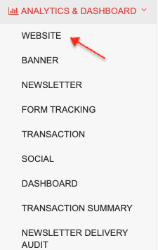
This will bring you to the Web Analytics main window, as shown below.

Note that there are 7 tabs in Web Analytics:
- Segments – pulls analytics data for a selected demographic
- Content - pulls analytics data by site content only
- Device – pulls analytics data by device used to access site
- Operating System – pulls analytics data by operating system used
- Referrer – pulls analytics data by site referrers
- Day - pulls analytics data by days of the week
- Hour – pulls analytics data by hours of a day
All tabs include the options for selecting criteria shown in the screenshot below.
SHARED OPTIONS FOR SELECTING CRITERIA (ALL TABS)

All tabs include the following seven options for selecting analytics criteria.
1. Date Range
2. Select Sites
3. Select Resources
4. Load (Selections) Template
5. Save (Selections) Template
6. Template List
7. Get Report
8. Select Content
Note that clicking on "Get Report" without making any selections will generate a summary report including all possible selections.
Date Range
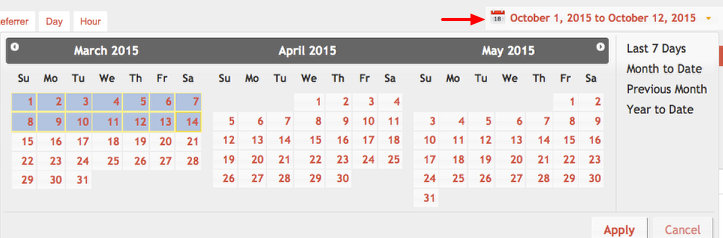
Date Range defaults to end date as current date and start date as week prior. Keep at default range or change by clicking in the date range field and using the drop-down calendar to select the desired range. To set the range, click on the desired start and end dates then click Apply. Note the options to the right of the calendars: Last 7 Days, Month to Date, Previous Month, Year to Date.
Select Sites
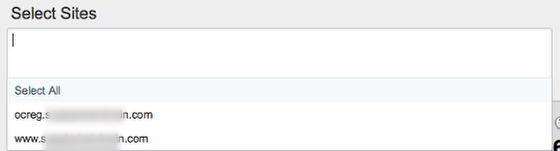
Clicking in the "Select Sites" field will present a drop-down of available domains to run anaytics on. Click on a domain(s) to select it or "Select All" for all domains.
The sites that appear in this list are configurable in the Config Manager.
Select Resources
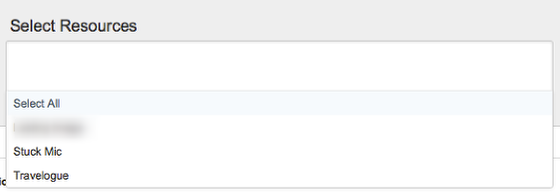
Clicking in the "Select Resources" field will present a drop-down of available resources to run anaytics on. Click on a resource to select it or "Select All" for all resources. More information on resources can be found in the Inventory module documentation.
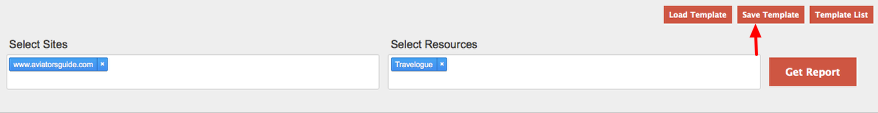
You can also enter the URL of a web page not designated as a resource. (See example in screenshot below.)
(For section-type resources, all pages within that section will be included in the anaytics. You don't need to enter the URL for individual pages within a designated section-type resource – just select the section then use the refine function to filter for a particular web page(s). More detail on refining is included in this lesson.
Note that entering the URL of a page will not add it to the drop-down list of selectable resources for later selection.
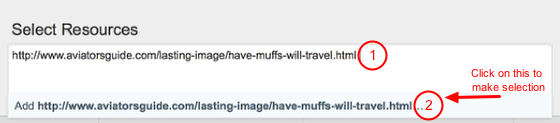
1) Enter the URL
2) Click on Add URL in the drop-down box
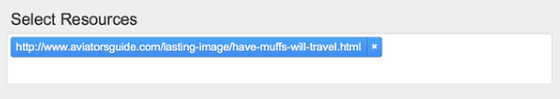
3) The URL will be selected, as shown below.
Note that pages entered in this way will not be saved in the drop-down list of selectable resources and won't be saved as a selection in a template.
More information on templates follows.
Load Selections Template
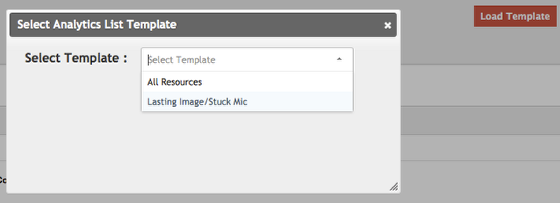
Clicking on the Load Template button will present a pop-up window where you can select a template of previously saved site and resource selections or select All Resources. Templates are particularly useful if you have a lot of sites and/or resources to select from and you frequently or regularly run the same selections.
Note that templates do not save date ranges.
Below is an example of a report with site, resources, and date range selected.

Save Selections Template
To save a new template or update an existing template, make your site and resource selections and click the "Save Template" button.
(You can load an existing template and add/remove sites and/or resources or you can not load a template and make new selections in the "Select Site" and "Select Resources" fields.)
Clicking on "Save Template" will present a pop-up window where you can select 1) Update or 2) New.
Update: Use this if you loaded an existing template and want to update that template with the modified selections.
For example:
An advertiser sponsors three sections of your site (each section is a resource) for the month of March.
You have a saved template for the site and those three resource selections.
For April, the advertiser sponsors an additional section and a new resource has been created for that section.
Load the saved template and add the new resource in "Select Resources".
Save the template, and the new resource will be added to the template.
New: Use this if you did not load an existing template for modification but enter new selections to be saved as a new template.
Template List
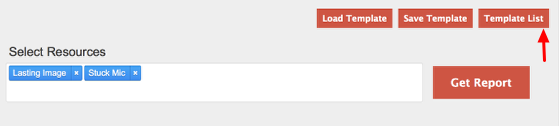
Clicking on the "Template List" button will bring up the template listing page, as shown below.
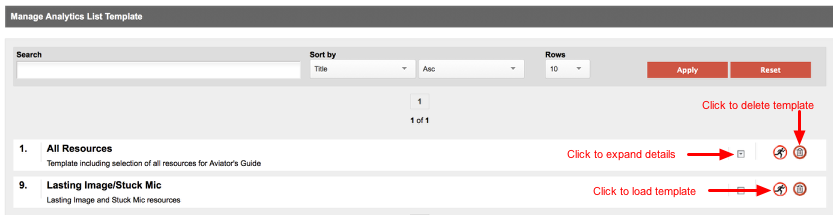
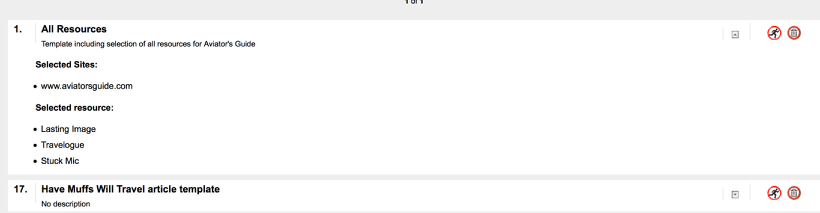
Expanded details will appear as shown below.
Get Report
When the date range is selected and all selections made, Click the "Get Report" button. This will load the analytics report on the page. (See example below.)
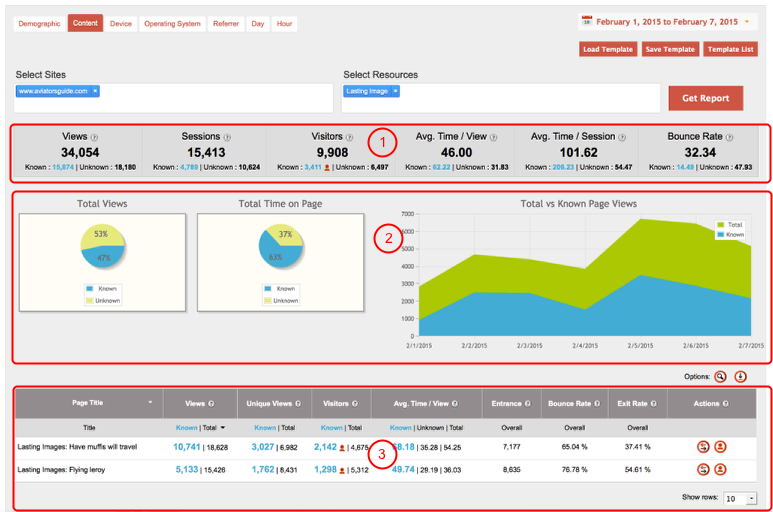
All reports, for all tabs, display in three main sections:
1) Aggregate data for all sites and resources/pages selected.
2) Charts/graphical representation of key data
3) Breakdown and detail of aggregate data
All reports, for all tabs, break out applicable metrics by Known, Total, and Unknown.
SHARED REPORT FEATURES, ICONS, AND OPTIONS (ALL TABS)
The features and options described below are available for each of the three summaries (Resources, Banner Campaign, and Newsletter Campaign).
Show Rows
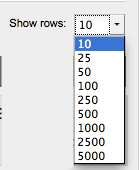
The default number of rows shown is 10. Use the drop-down menu to display more than 10 rows (up to 5,000).
You should select the appropriate number of rows to display whether or not you use either of the options described below (Refine Report, Download Report).
User Data Analysis

Clicking on this icon will bring you into the List Wizard where you can download the list of Known users, filter/segment the list further, and/or perform various administrative actions on the list. (See List Wizard documentation for more information on functionality.)
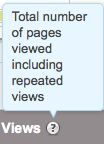
Information

Clicking a " ? " in any table column heading will bring up a pop-up explaining the heading label. (See example below.)
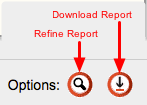
Refine Report
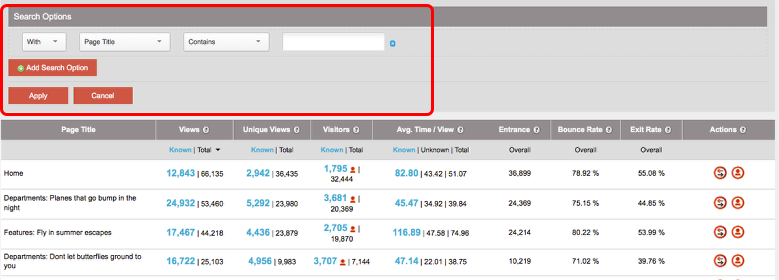
You can refine/filter your report by using the following search options and entering the value in the blank field:
With / Without > Page Title > Contains / Matches / Matches Exactly / Begins With / Ends With
With / Without > Views / Unique Views / Avg. Time on Page > Total / Known / Unknown > Equals / Greater Than / Less Than
With / Without > Entrance / Bounce Rate / Exit Rate > Equals / Greater Than / Less Than
For example, if you want to refine the report in the screenshot above to show only those resources/pages that begin with the word "Department" and that have 10,000+ Known page views, you would use the following options:
With > Page Title > Begns With > Departments
With > Page Views > Known > Greater Than > 10000 > Apply (See below.)
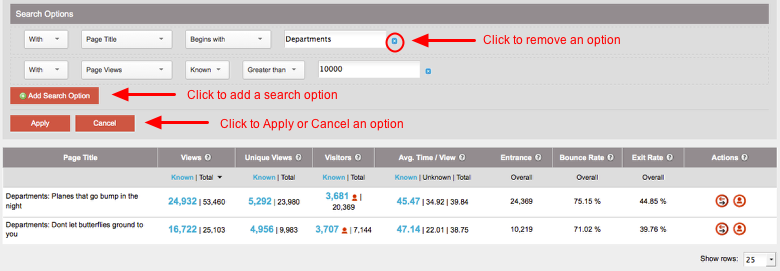
You may add multiple search options by clicking on the "Add Search Option" button. Multiple search options are joined by AND logic.
To remove an option, click on the blue "x" the right of the value field.
Don't use commas in values, i.e. enter 23980 NOT 23,980.
For values that contain decimals, i.e. Avg. Time/View, Bounce Rate, and Exit Rate you cannot use the "Equals" option. The system rounds decimals for display, and when a value is entered the system searches the database, where the values aren't stores as rounded values. For example, if you enter "Equals 45.15", the system will search the database for that value, but the value in the database may be calculated to be 45.1489524, so it won't be a match. The system will, however, display this value as 45.15; but this isn't the actual value.
Note: When options are removed or cancelled, you must click on "Apply" again to refresh the report.
Download Report
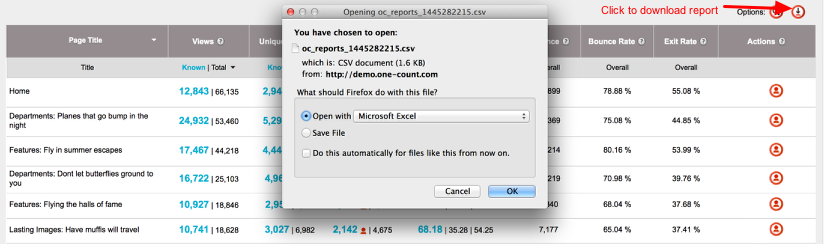
Downloading a report will download the report, as it is displayed, in .csv format.
If 25 rows are displayed, those 25 rows will be downloaded; if 50 rows are displayed, those 50 rows will be downloaded, etc.
Known | Unknown | Total
Known = Includes users in your database who have been identified and authenticated by ONEcount.
Unknown = Includes counts of those users who are not authenticated/have not been identified by the ONEcount system. A user may be in your database but be an unkown if they haven't been authenticated by logging in, clicking on a smartlink in an email, or completing a subscription/registration form for a new product.
Total = ** Known + Unknown counts
Search all Documentation:
Unknown macro: livesearch. Click on this message for details.
Search ANALYTICS Documentation:
Unknown macro: pagetreesearch. Click on this message for details.
On this page:
More ANALYTICS Documentation: